

Research Question:
What is the effect of light pollution based on the Bortle Scale on the total bird population in each U.S state in 2023?
Background Information
In this investigation, I will be exploring if the measured amount of light pollution in each state has an effect on the population of birds that state due to the effects of light pollution. In this investigation, my manipulated variable is the measured amount of light pollution based on the Bortle Scale in each state, and my responding variable is the total bird population of each state. My investigation relates to the IB Biology curriculum ecology because it explores an organisms’ relationship with their environment, community, and ecosystem. I am interested in exploring this topic because I encountered many birds that died from colliding with windows within my school campus. Upon further research, I learned that this was one of the many effects that light pollution had on birds. I was also interested in exploring this topic after I learned about light pollution for an eight-grade science project, and I think that the concept of light pollution is fascinating in how it can affect the environment and different organisms. Researching this topic helps me understand the effects of light pollution on organisms, specifically birds, and spread awareness on the dangers of light pollution on the bird population in the United States.
According to a jstor.org article entitled “Green Light for Nocturnally Migrating Birds,” birds rely on visual cues and a magnetic compass during migration. Artificial lights can interfere with the magnetic compass in which birds rely on to determine their migration patterns. Also, birds are assumed to be reliant on light to help follow their migration patterns (Lacy). The presence of artificial light can cause birds to be misguided in their migration patterns and collide with buildings. It can also lead them to the wrong direction and elongate their travel, causing exhaustion and increasing the fatality rates of birds. Also, light pollution is caused by the excess brightening of the night sky using artificial lights which affects the natural cycle (Hurley). Some examples of light pollution causing a disruption to nature is by blocking the visibility of stars in the sky as well as harming animals by misguiding their migration route and causing them to die due to colliding with buildings (Hurley).Therefore, calculating the correlation between light pollution levels of each state and the bird population levels of each state can prove how light pollution affects bird population and how reducing the use of artificial light can preserve the bird populations.
The Smithsonian magazine conducted a similar investigation by collecting as many bird species as they could that died due to collision with buildings during the migration season. At 5:30 in the morning, volunteers would go outside during migration season and look for any birds that may have collided with buildings in D.C. Then, they would collect the dead birds and donate them to museums to raise awareness while also trying to save birds that survived the collisions. In total, they collected just under 600,000 bird species and estimated that around 300 million to 1 billion birds were killed due to light pollution and collision with glass buildings. Furthermore, the researchers are also a part of the “Lights Out” exhibition in D.C which aims to reduce light pollution and help combat the mortality rate of birds due to them colliding with buildings from light pollution (Saaty).
Variables
The manipulated variable of this experiment is the light pollution of each state based on the Bortle Scale. Light pollution can be measured using the Bortle Scale, which according to the website explainingscience.org, the Bortle Scale “use the visibility of the Milky Way and other astronomical objects to assess how dark the sky is and give it a rating between 1 and 9 on the scale…” (Hurley). Using the website lovethenightsky.com, I determined the light pollution level of each state based on the Bortle Scale. The Bortle Scale consists of 9 levels, where a level 1 is little to no light pollution and a level 9 is extreme light pollution. The manipulated variable was manipulated based on the different U.S states that are on different levels of the Bortle Scale. The data can be uncertain as the light pollution level in each state changed since the data was collected.
In this experiment, the responding variable is the bird population in each U.S state. I obtained the bird population of each state from the website ebird.org, where they track the number of species found in each state using sight and sound to locate a bird at a fixed position. It also tracks the total bird population in each state. One uncertainty is that the data is constantly altered on the website due to it being updated frequently. In order to avoid inconsistencies in my data, I used the data chart I found on September 24, 2023, as the official bird population of each state for this exploration. I ensured that enough data was collected as data was collected from all 50 states in the U.S rather than only collecting the light pollution and bird population data from only one state. This also ensured that there is more variation in the data sets so that the investigation is more accurate and not solely based on one piece of data.
The controlled variable is the time period in which the two data sets was collected and the country that the data sets are collected from. I ensured that the manipulated data (the amount of light pollution in each state) was recorded in 2023 as well as the responding data (the bird population in each state) was also recorded in 2023. I also found the light pollution levels and bird populations solely from states in the U.S and not from other countries. It is important to have controlled variables to confirm that the manipulated variable has a direct effect on the responding variable and was not caused by other factors that could effect the responding variable.
Hypothesis
My hypothesis is that if the light pollution level of each state is low on the Bortle Scale, then the bird population of that state will be higher because light pollution causes the fatality rate of birds to increase as it alters the migration patterns of birds.
– Null Hypothesis: the bird population in each state is not affected by their light intensity level based on the Bortle Scale.
– Alternative Hypothesis: the bird population in each state is affected by their light intensity level based on the Bortle Scale.
Materials And Methodology
Materials:
– Ebird.org website
– Lovethenightsky.com website
– Excel
– Laptop
First, I found the data set of all the U.S states and what their light pollution levels are in 2023 based on the Bortle Scale. Then, I went to the ebird.org website to determine the total number of birds in each state in 2023; the population number consists of all types of bird species. I made a chart with one column listing all 50 states, one column listing the light pollution level of each state on the Bortle Scale, and a third column on the total bird population in each state. Then, using Excel, I found the mean number of birds in each state and the mode of the Bortle Scale level from all the U.S states. I calculated both mean and mode because my manipulated data was a set of discrete data and was better fit to be calculated using mode to find its central tendency, while the responding data was a set of continuous data and its central tendency needed to be calculated using mean. Then, I found the correlation coefficient number between the two data sets through excel to determine the strength of the relationship between the two variables. If there is a correlation, it will be understood that bird population is affected by the amount of light pollution in the area. Afterwards, I determined which hypotheses is true using the ANOVA calculation method which helped me determine the p-value and form a conclusion. Because my manipulated dataset is discrete and my responding dataset is continuous, I chose ANOVA as my method of calculation because it finds the correlation between a set of discrete and continuous data.
Safety, Ethics, and Environmental Impact
It is important to be aware of the safety and environmental impact that comes from this investigation. When conducting this experiment, it is necessary to acknowledge that an increase in light pollution could harm the lives of migratory birds and other animals. Increasing the presence of light pollution in an area that is prone to migrating animals can cause them to lose their navigation and travel away from their intended migration path. Therefore, while conducting my investigation, no birds were harmed as I only collected recorded data of light pollution and the bird populations of each state rather than conducting my own experiment and exposing birds to more harmful environments.
Results
Descriptive statistics: calculations of mean and mode
I used Excel to calculate the mean and mode of the data set and find the central tendencies. This table can be found in the appendix as “table 1.” The mean number of birds in each state was 1,090,326 birds. The mode level of light pollution on the Bortle Scale in each state was a level 2.
Correlation Coefficient:
After calculating the correlation coefficient through Excel, the value was -0.14791, which indicates that there is a negative correlation between the two values. However, the value is between 1 and -1 which indicates that the significance between the two variables is not strong. Refer to figure 2 in the appendix.
Inferential Statistic: ANOVA
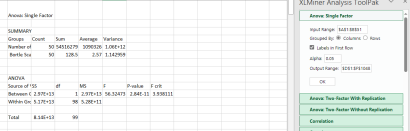
Based on the ANOVA calculations, the p-value was 2.84 x 10⁻¹¹, which is less than the significance level of 0.05. Thus, the null hypothesis is rejected, proving that there is a significance between the two variables. This is shown in figure 3 in the appendix.
Graph
I used a scatter plot to represent the relationship between light pollution levels based on the Bortle Scale and the Bird population of each state. Also, scatter plots best represent ANOVA calculations and the relationship between the two data sets.
Figure 4: Graph of the data set
Relationship Between Light Pollution Levels and Bird Population From Each U.S States
6,000,000
Total Bird Population in Each StateLight Pollution Level on the Bortle Scale (1-9)
5,000,000
4,000,000
3,000,000
2,000,000
1,000,000
0
0 1 2 3 4 5
The graph above represents the relationship between the light pollution level of each U.S state and their total bird population. The x-axis represents the light pollution level of each state based on the Bortle Scale, and the y-axis represents the total bird population of each state. Each plot represents a U.S state. The descending trendline suggests that as the light pollution level on the Bortle Scale increases, the total bird population number decreases. The two variables have a slight negative correlation.
Analysis and Conclusion
Based on my hypothesis, if the light pollution level of each state is low on the Bortle Scale, then the bird population of that state will be higher because light pollution causes the fatality rate of birds to increase as it alters the migration patterns of birds. I calculated my data using the ANOVA correlation calculation method in which I found the p-value between the two variables to determine if there is a correlation between the light pollution level of each state and their total bird population. I compared the p-value number to the significance level of 0.05. Based on the significance level and my p-value, I reject the null hypothesis because the p-value of the data table is 2.84 x 10⁻¹¹, which is less than 0.05. Therefore, the light pollution level of each state based on the Bortle Scale does have an effect on the total bird population of each state. Overall, the alternate hypothesis is favored in this exploration.
As I was analyzing the data points on my data table, I noticed that California was the state with the highest bird population of 5,243,366 birds, and the state’s light pollution on the Bortle Scale was a 1; supporting the conclusion that was made by the ANOVA calculations. Similarly, Rhode Island was at a level 4 of light pollution and only had 189,408 birds, also supporting my results. However, the data obtained by some states contrasted my hypothesis and was an outlier to the rest of my data. For example, New Jersey had 1,351,625 birds which is a significant number in comparison to the total bird populations of the other states, however, New Jersey is at a level 4.5 on the Bortle Scale, showing it to be an outlier as it contradicts the hypothesis.
The controlled variables, the year that the data was found, helped portray the relationship between bird populations and the light pollution levels in each state more accurately. Finding the two sets of data from the same year showed how the different light pollution levels in each state had an effect on the bird population of each state in 2023; this controlled variable helped strengthen the investigation. The bird population numbers change almost daily, so it was important to find both data sets from the same year to see how light pollution directly affects the bird population when they exist simultaneously. Another strength to the investigation was that enough data points were collected to draw a confident conclusion. However, a weakness to the investigation was that the bird population data was too general and could have mislead the results of the experiment. Using the total bird population in each state instead of focusing on a specific migratory bird species does not accurately portray how light pollution affects the bird population, especially during migration.
Limitations
One limitation was that the date in which the data of the Bortle Scale level for each U.S state was taken was not stated on the website, but only the year in which it was published was listed. This is a limitation because the light pollution levels for some states could have been different during the time the total bird population data for each state was taken. Also, seasonal changes and different daylight times could also affect the experiment as light pollution may increase/decrease depending on the amount of daylight present. Another limitation is that the data set with the location of the light pollution levels are too general and does not consider which areas are more populated with migratory birds. Hence, states with more migratory birds are more affected compared to states that lack migratory birds and have little to no relationship with bird migration patterns in their area. If this limitation is not considered, the conclusion to the investigation would be misguided.
Suggestions
One aspect of my research that would strengthen my exploration is to acknowledge the different type of species that are seen in each state; this would help determine which states have more migratory bird species than other states. The presence of more migratory birds in a state may alter the conclusion, which simply considered the total number of birds in each state and their light pollution levels. Additionally, understanding the natural migration of birds in the United States could also strengthen the conclusions made in this exploration because it can show how the amount of artificial light in the migration pathway of birds have a greater impact in the decrease of bird population, further solidifying the conclusion. In future research, I would collect more specific data points to ensure higher accuracy within my investigation. I would specify the locations of light pollution to different major cities and collect the total bird population of a specific migratory species.
Appendix
Table 1: Number of birds in each U.S. state and their brightness level on the Bortle Scale.
| State | Light Pollution Level on Bortle Scale (1-9) | Number of Birds |
| Alabama | 2 | 378,140 |
| Alaska | 1 | 470,619 |
| Arizona | 2 | 1,760,542 |
| Arkansas | 2 | 285,275 |
| California | 1 | 5,243,366 |
| Colorado | 1 | 1,734,710 |
| Connecticut | 4 | 838,061 |
| Delaware | 4 | 285,079 |
| Florida | 3 | 2,756,473 |
| Georgia | 4 | 978,105 |
| Hawaii | 1 | 243,570 |
| Idaho | 2 | 450,032 |
| Illinois | 3 | 1,685,789 |
| Indiana | 4 | 795,320 |
| Iowa | 3 | 290,954 |
| Kansas | 3 | 459,392 |
| Kentucky | 4 | 334,746 |
| Louisiana | 3 | 400,253 |
| Maine | 2 | 921,817 |
| Maryland | 4 | 1,466,132 |
| Massachusetts | 4 | 1,921,825 |
| Michigan | 2 | 1,892,208 |
| Minnesota | 1 | 1,187,732 |
| Mississippi | 4 | 193,272 |
| Missouri | 3 | 679,095 |
| Montana | 1 | 499,363 |
| Nebraska | 2 | 267,565 |
| Nevada | 1 | 256,105 |
| New Hampshire | 3 | 472,136 |
| New Jersey | 4.5 | 1,351,625 |
| New Mexico | 2 | 677,020 |
| New York | 2 | 3,424,049 |
| North Carolina | 2 | 1,313,228 |
| North Dakota | 3 | 170,117 |
| Ohio | 4 | 1,892,792 |
| Oklahoma | 2 | 277,317 |
| Oregon | 1 | 1,823,889 |
| Pennsylvania | 3 | 2,473,639 |
| Rhode Island | 4 | 189,408 |
| South Carolina | 4 | 662,926 |
| South Dakota | 2 | 139,491 |
| Tennessee | 3 | 740,098 |
| Texas | 2 | 3,241,817 |
| Utah | 1 | 574,611 |
| Vermont | 3 | 670,569 |
| Virginia | 3 | 1,620,732 |
| Washington | 2 | 1,983,251 |
| West Virginia | 3 | 235,038 |
| Wisconsin | 2 | 1,673,070 |
| Wyoming | 2 | 233,916 |
Figure 1: Mean and mode calculations on Excel

Figure 2: Correlation coefficient calculation on Excel
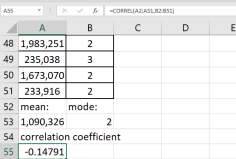
Figure 3: ANOVA calculation on Excel

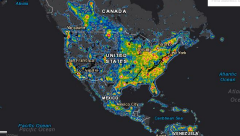
https://www.cloudynights.com/topic/701406-any-comments-on-astron-picture-on-bortle-scale/ Figure 6: Map of Light Pollution in the U.S Published on June 10, 2023
Works Cited
“Any comments on Astron. Picture on Bortle scale? – Light Pollution.” Cloudy Nights, 9 April 2020, www.cloudynights.com/topic/701406-any-comments-on-astron-picture-on-bortle-scale/. Accessed 29 January 2024.
Bortle, John E. “Light Pollution and Astronomy: How Dark Are Your Night Skies?” Sky & Telescope, 18 July 2006, skyandtelescope.org/astronomy-resources/light-pollution-and-astronomy-the bortle-dark-sky-scale/. Accessed 19 December 2023.
ebird.org/region/US/regions?yr=all&m=&hsStats_sortBy=cl&hsStats_o=desc. Accessed 19 December 2023.
Hurley, Steve. “Dark Sky Places – Explaining Science.” Explaining Science, 3 May 2020, explainingscience.org/2020/05/03/dark-sky-places/. Accessed 19 December 2023. Kuthunur, Sharmila. “Where are the darkest skies in the US, and how to find them?” Love the Night Sky, lovethenightsky.com/us-darkest-skies/. Accessed 19 December 2023.
Lacy, Steve. “.” . – YouTube, 2 October 2022, www.jstor.org/stable/26267982?seq=2. Accessed 19 December 2023.
“The New World Atlas of Artificial Sky Brightness.” Cooperative Institute for Research in Environmental Sciences, 10 June 2023, cires.colorado.edu/Artificial-light. Accessed 29 January 2024.
Saaty, Emma. “Turning Off Your Lights Could Save Millions of Birds Each Year from Deadly Building Collisions.” Smithsonian Magazine, 19 April 2023, www.smithsonianmag.com/blogs/national museum-of-natural-history/2023/04/19/turning-off-your-lights-could-save-millions-of-birds each-year-from-deadly-building-collisions/. Accessed 19 December 2023.


